According to the U.S. Census Bureau, the Bureau's Population Estimates Program (PEP) produces estimates of the population for the United States, its states, counties, cities, and towns, as well as for the Commonwealth of Puerto Rico and its municipios. Demographic components of population change (births, deaths, and migration) are produced at the national, state, and county levels of geography. Additionally, housing unit estimates are produced for the nation, states, and counties.
PEP annually utilizes current data on births, deaths, and migration to calculate population change since the most recent decennial census and produce a time series of estimates of population, demographic components of change, and housing units. The annual time series of estimates begins with the most recent decennial census data and extends to the vintage year. As each vintage of estimates includes all years since the most recent decennial census, the latest vintage of data available supersedes all previously produced estimates for those dates.
This dashboard includes PEP data from 2000 to present. For the years 2000, 2010, and 2020, population estimates base values are presented, while estimates are presented all other years. As noted, estimates for each year since the most recent decennial census are updated annually by the Census Bureau. As a result, estimates for years 2021 and later in this dashboard may change annually as new PEP estimates are released. Each year, state and county resident population estimates by age, sex, race, and Hispanic origin are published, forming the basis for this dashboard.
Additional information related to the Census PEP can be found at the following link:
https://www.census.gov/programs-surveys/popest/about.html.
Dashboard Filters and Demographics
This dashboard includes data at the State of Nebraska, local health department, behavioral health region, and county level and allows results to be viewed by sex, age, and race/ethnicity.
Geographic Characteristics
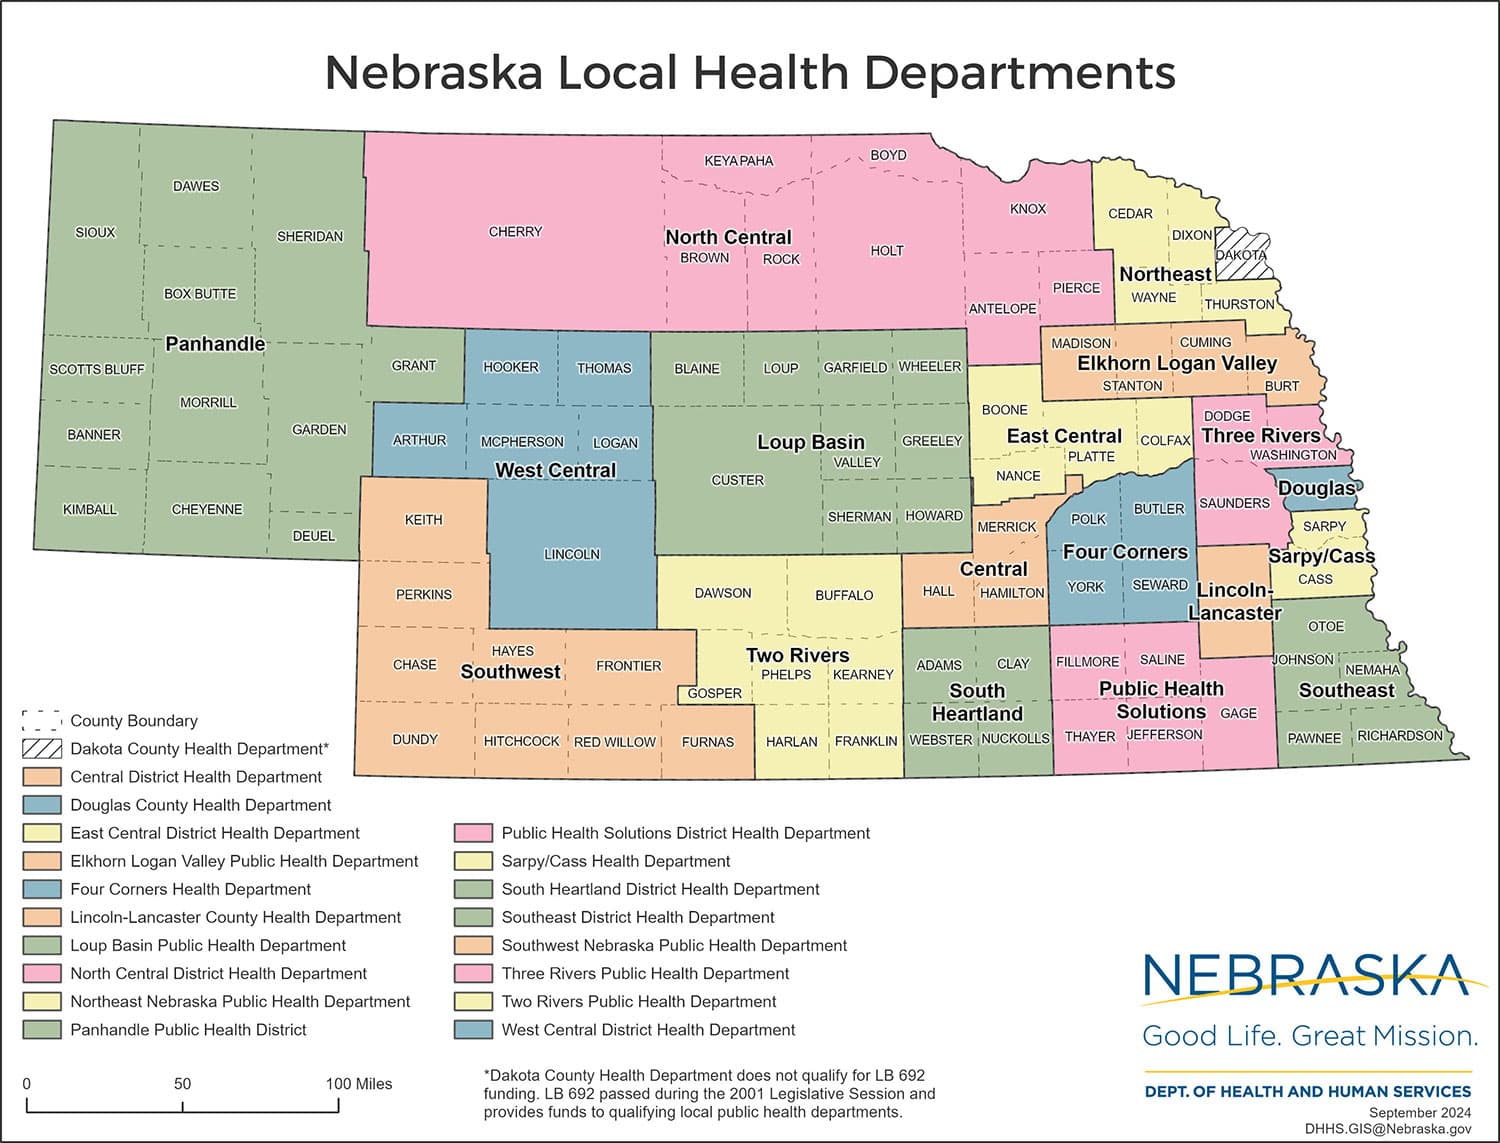
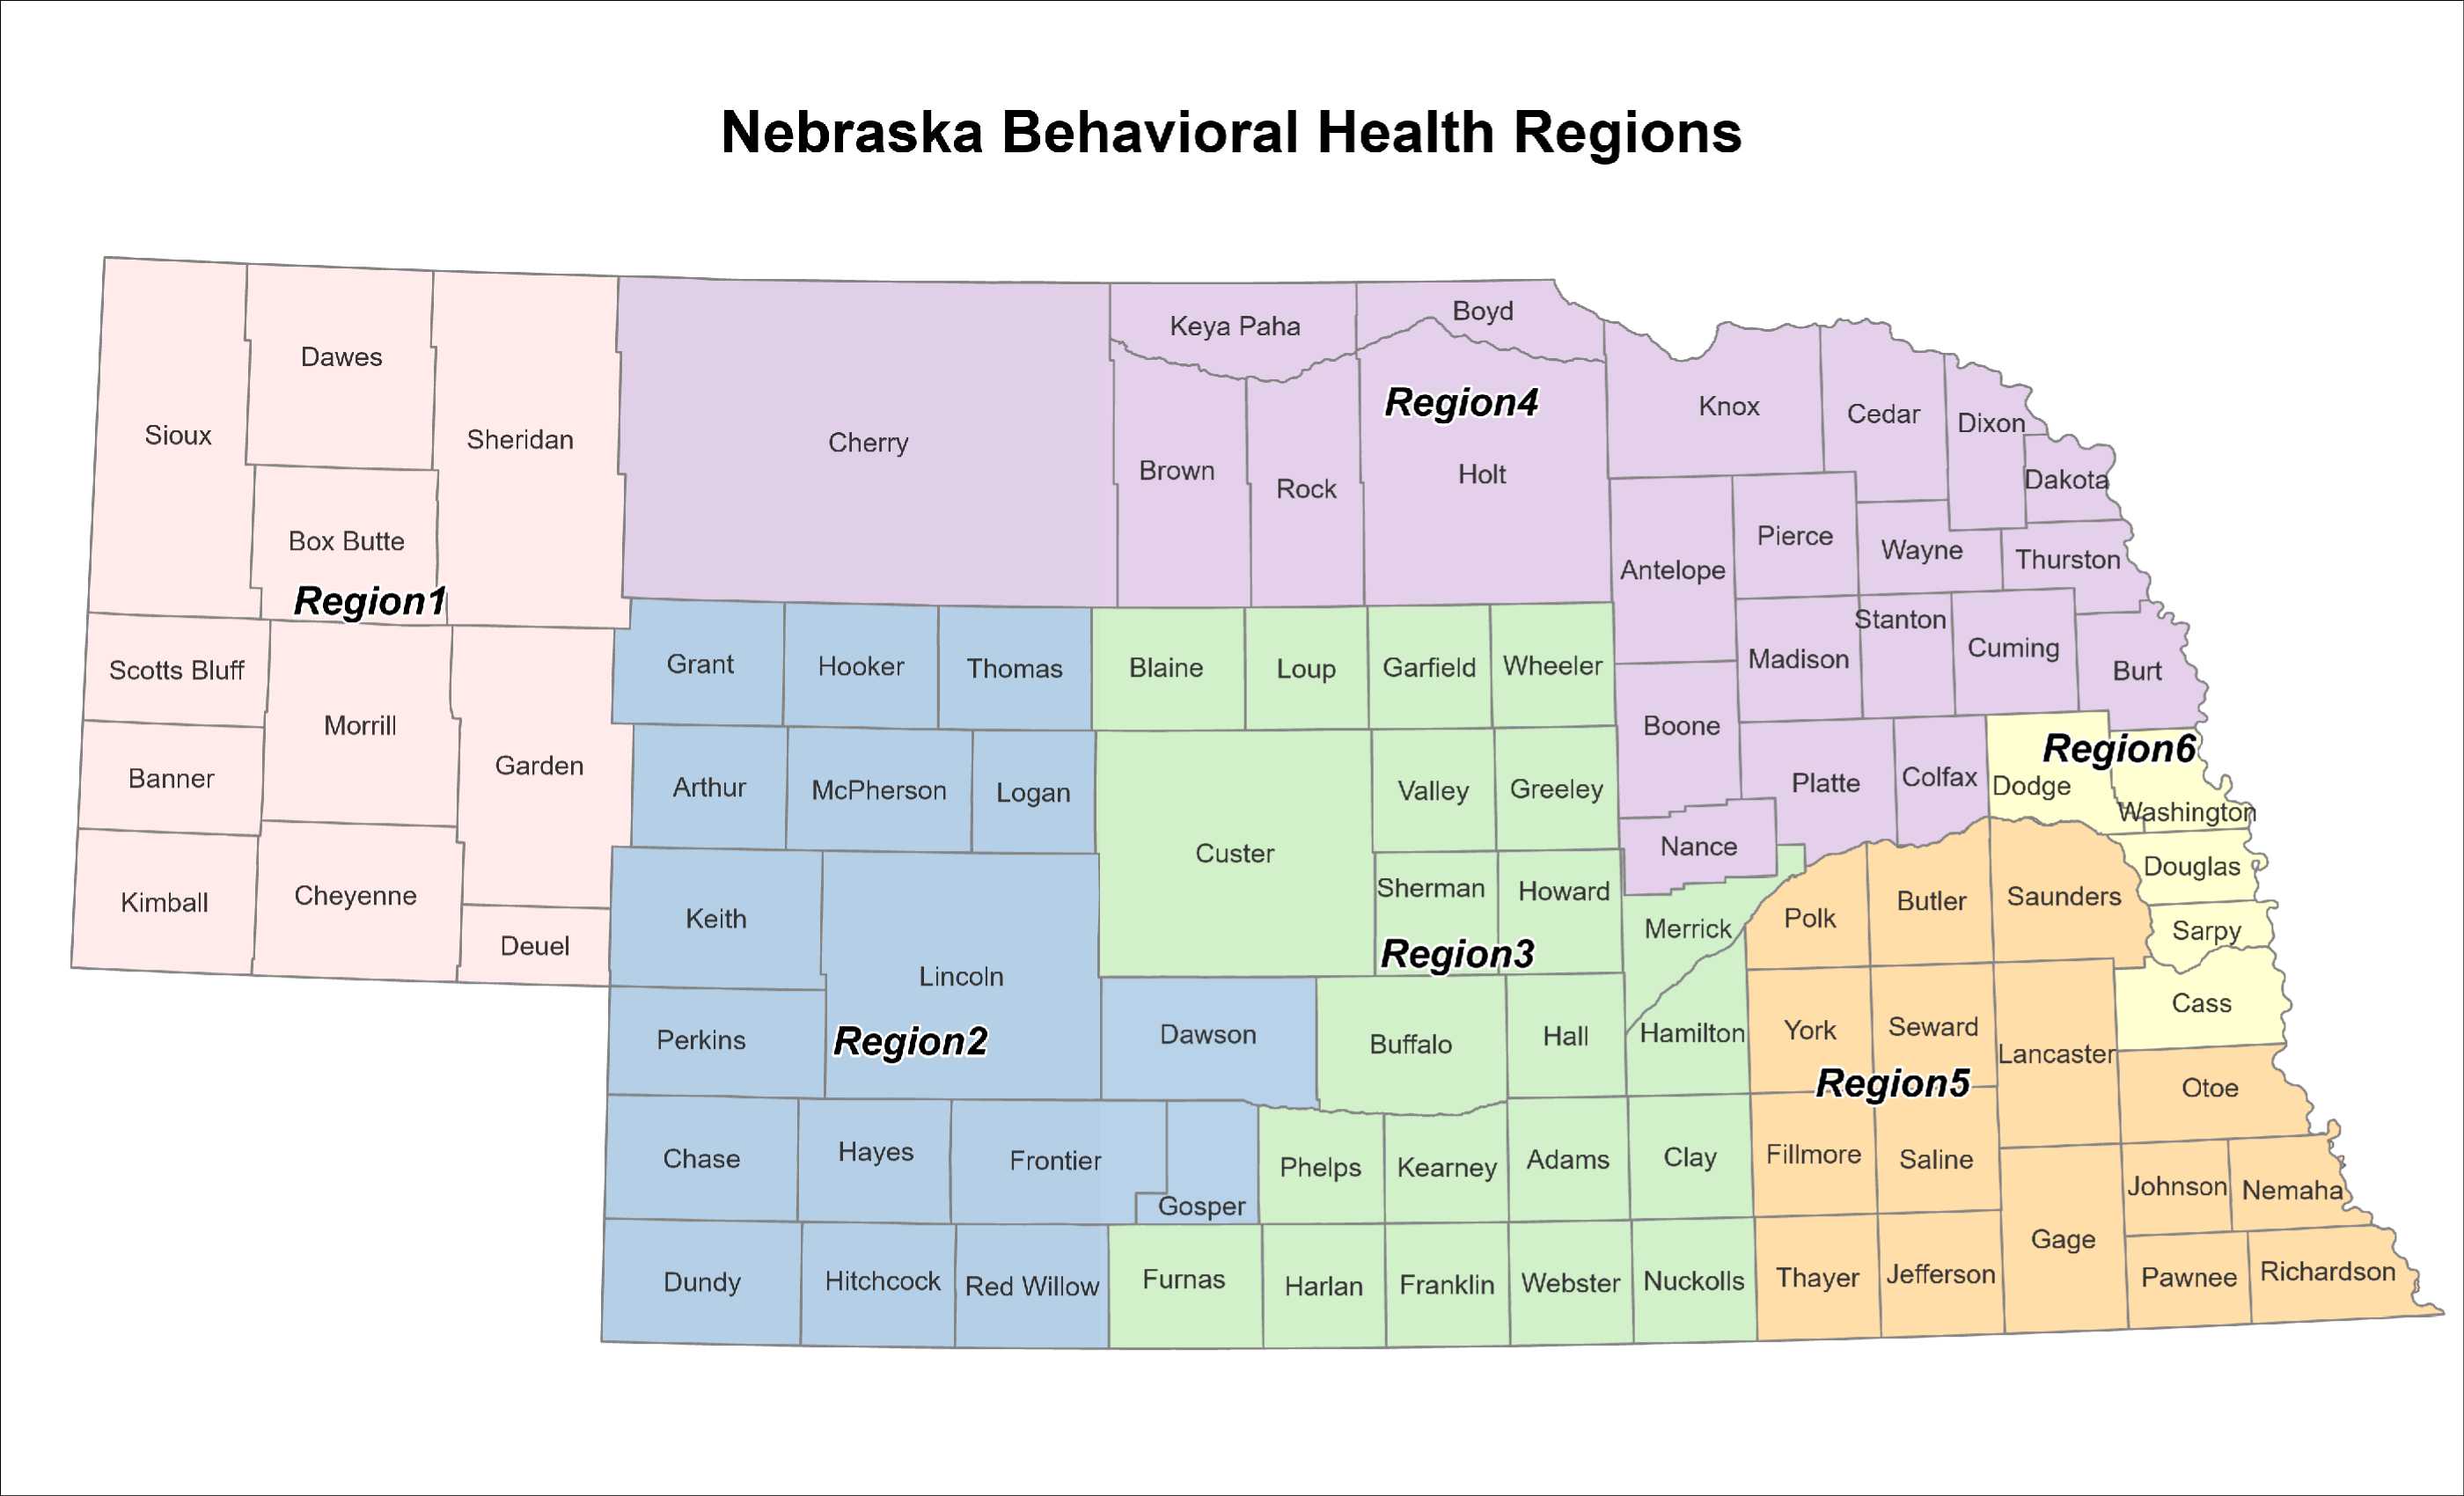
Results can be filtered by four geographic classifications: the State of Nebraska overall and individually for each of the state's 19 local health department (LHD) regions, six behavioral health (BH) regions, and 93 counties. The following map identifies the counties included in the LHD and BH regions.
Urban/Rural
Results can also be reported by the degree of urbanization based on county of residence. While there are numerous ways to define urbanization, three categories are included within this dashboard. These categories are based on “Reporting Category 1" within the
Disparities Demographic Data Recommendations Report, Division of Public Health, NDHHS, November 2016. The counties included within each category are grouped and labeled as follows:
Urban‐Large (7 counties)
Cass, Douglas, Lancaster, Sarpy, Saunders, Seward, Washington
Urban‐Small (15 counties)
Adams, Buffalo, Dakota, Dawson, Dixon, Dodge, Gage, Hall, Hamilton, Howard, Lincoln, Madison, Merrick, Platte, Scotts Bluff
Rural (71 counties)
Antelope, Arthur, Banner, Blaine, Boone, Box Butte, Boyd, Brown, Burt, Butler, Cedar, Chase, Cheyenne, Clay, Colfax, Cuming, Custer, Dawes, Deuel, Dundy, Fillmore, Franklin, Frontier, Furnas, Garden, Garfield, Gosper, Grant, Greeley, Harlan, Hayes, Hitchcock, Holt, Hooker, Jefferson, Johnson, Kearney, Keith, Keya Paha, Kimball, Knox, Logan, Loup, McPherson, Morrill, Nance, Nemaha, Nuckolls, Otoe, Pawnee, Perkins, Phelps, Pierce, Polk, Red Willow, Richardson, Rock, Saline, Sheridan, Sherman, Sioux, Stanton, Thayer, Thomas, Thurston, Valley, Wayne, Webster, Wheeler, York
Demographic Characteristics
Age
Results are reported in five age categories on the summary page, including 0-4, 5-9, 20-34, 35-64, and 65+. Within the demographics and trends sections, results are reported across three different age groupings, including 18 categories: 0-4, 5-9, 10-14, 15-19, 20-24, 25-29, 30-34, 35-39, 40-44, 45-49, 50-54, 55-59, 60-64, 65-69, 70-74, 75-79, 80-84, 85+; 8 categories: 0-14, 15-24, 25-34, 35-44, 45-54, 55-64, 65-74, 75+; and 4 categories: 0-24, 25-44, 45-64, 65+.
Sex
Data reported for female and male.
Race and Ethnicity
Race and ethnicity are separate concepts and fields captured within the Census; however, they are combined into six mutually exclusive categories for reporting within this dashboard. The six categories include: White, Non-Hispanic (White, NH); Black or African American, Non-Hispanic (Black, NH); Asian, Native Hawaiian or other Pacific Islander, Non-Hispanic (Asian/PI, NH); American Indian or Alaska Native, Non-Hispanic (American Indian, NH); More than one race, Non-Hispanic (Multiracial, NH); and Hispanic or Latino, regardless of race (Hispanic).
Year
Results can be reported by single year for 2000 through the most recent available year.
Dashboard Statistics
The following statistics are presented in the dashboard:
Population Count
The estimated number, or population count, of persons for the selected year, geographic region, and demographic population.
Population Percentage
The population percentage reflects the population count per individual category divided by the total population for the selected year(s), geographic region, and/or demographic population.
Data Suppression
Census PEP data are publicly available for download from the U.S. Census Bureau's website. Therefore, no data suppression is required, and the data can be presented geographically at the county level.
Data Use Limitations
PEP data are estimates rather than actual population counts and should be interpreted as such. Estimating population changes can be particularly challenging for small geographic areas or demographic groups, such as those found in parts of Nebraska.
Contact